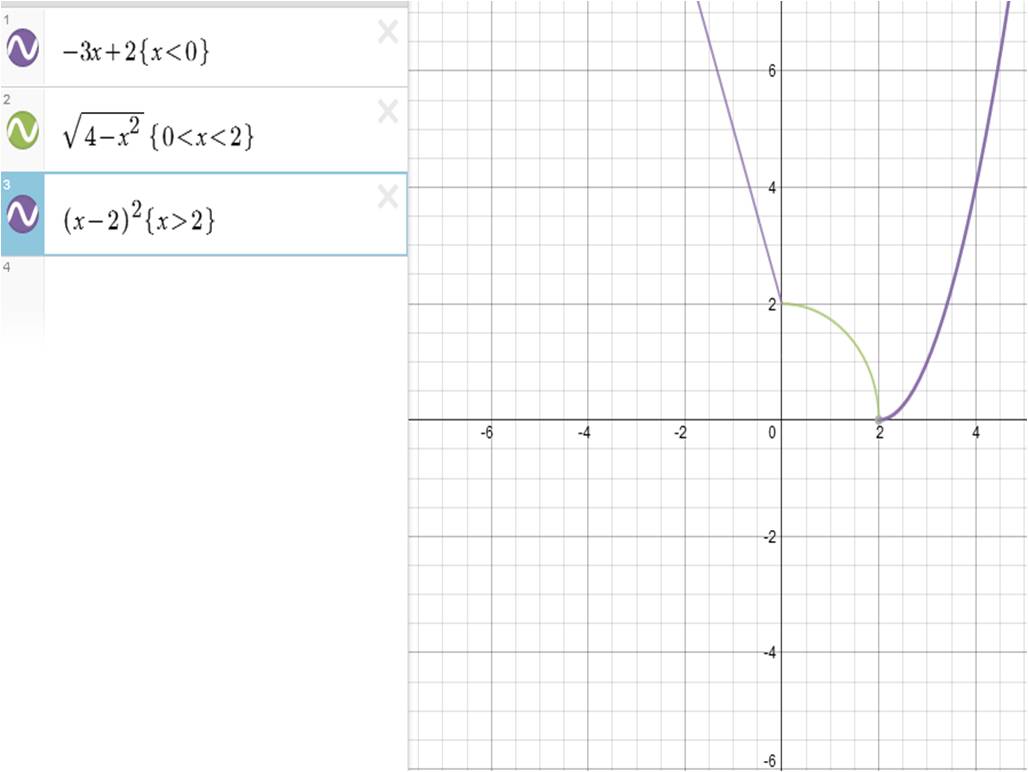
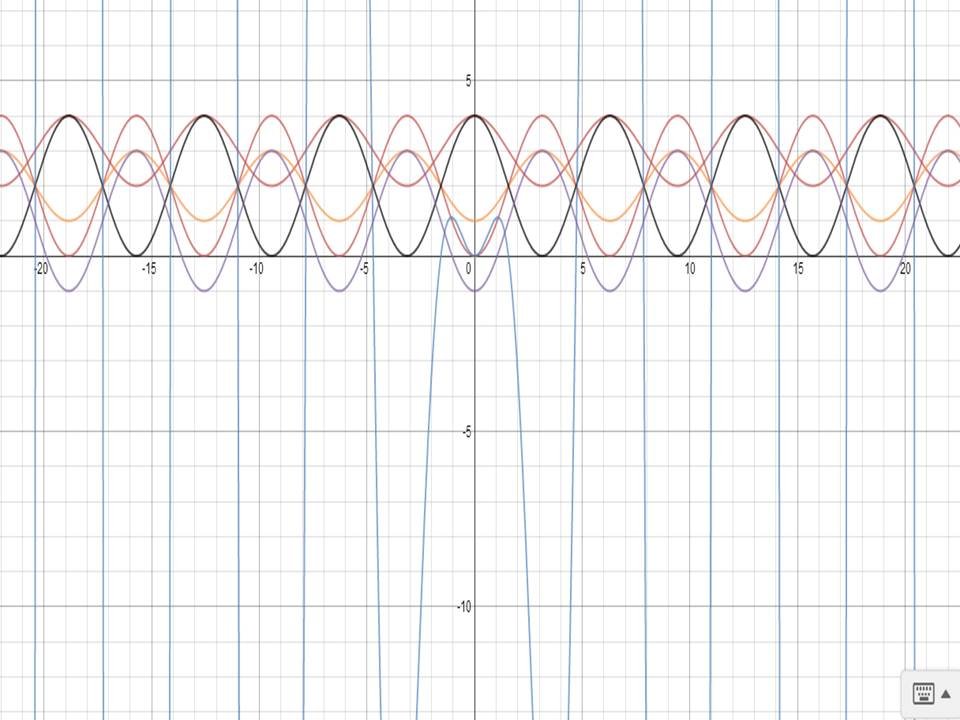
So this graph was basically a combination of 3 other graphs. In order to get them put together you just have to insert brackets and set x to greater than or less than 0 in order to make the line stop at a specific point. The domain and range switched 3 different times going from all real numbers, to [-2,2],(0,2]
 RSS Feed